

Updates to USDA Pasture, Range, and Forage Insurance: Choosing Insurance in 2027
October 12, 2026
By Kelsey Larson and Andrew Swanson
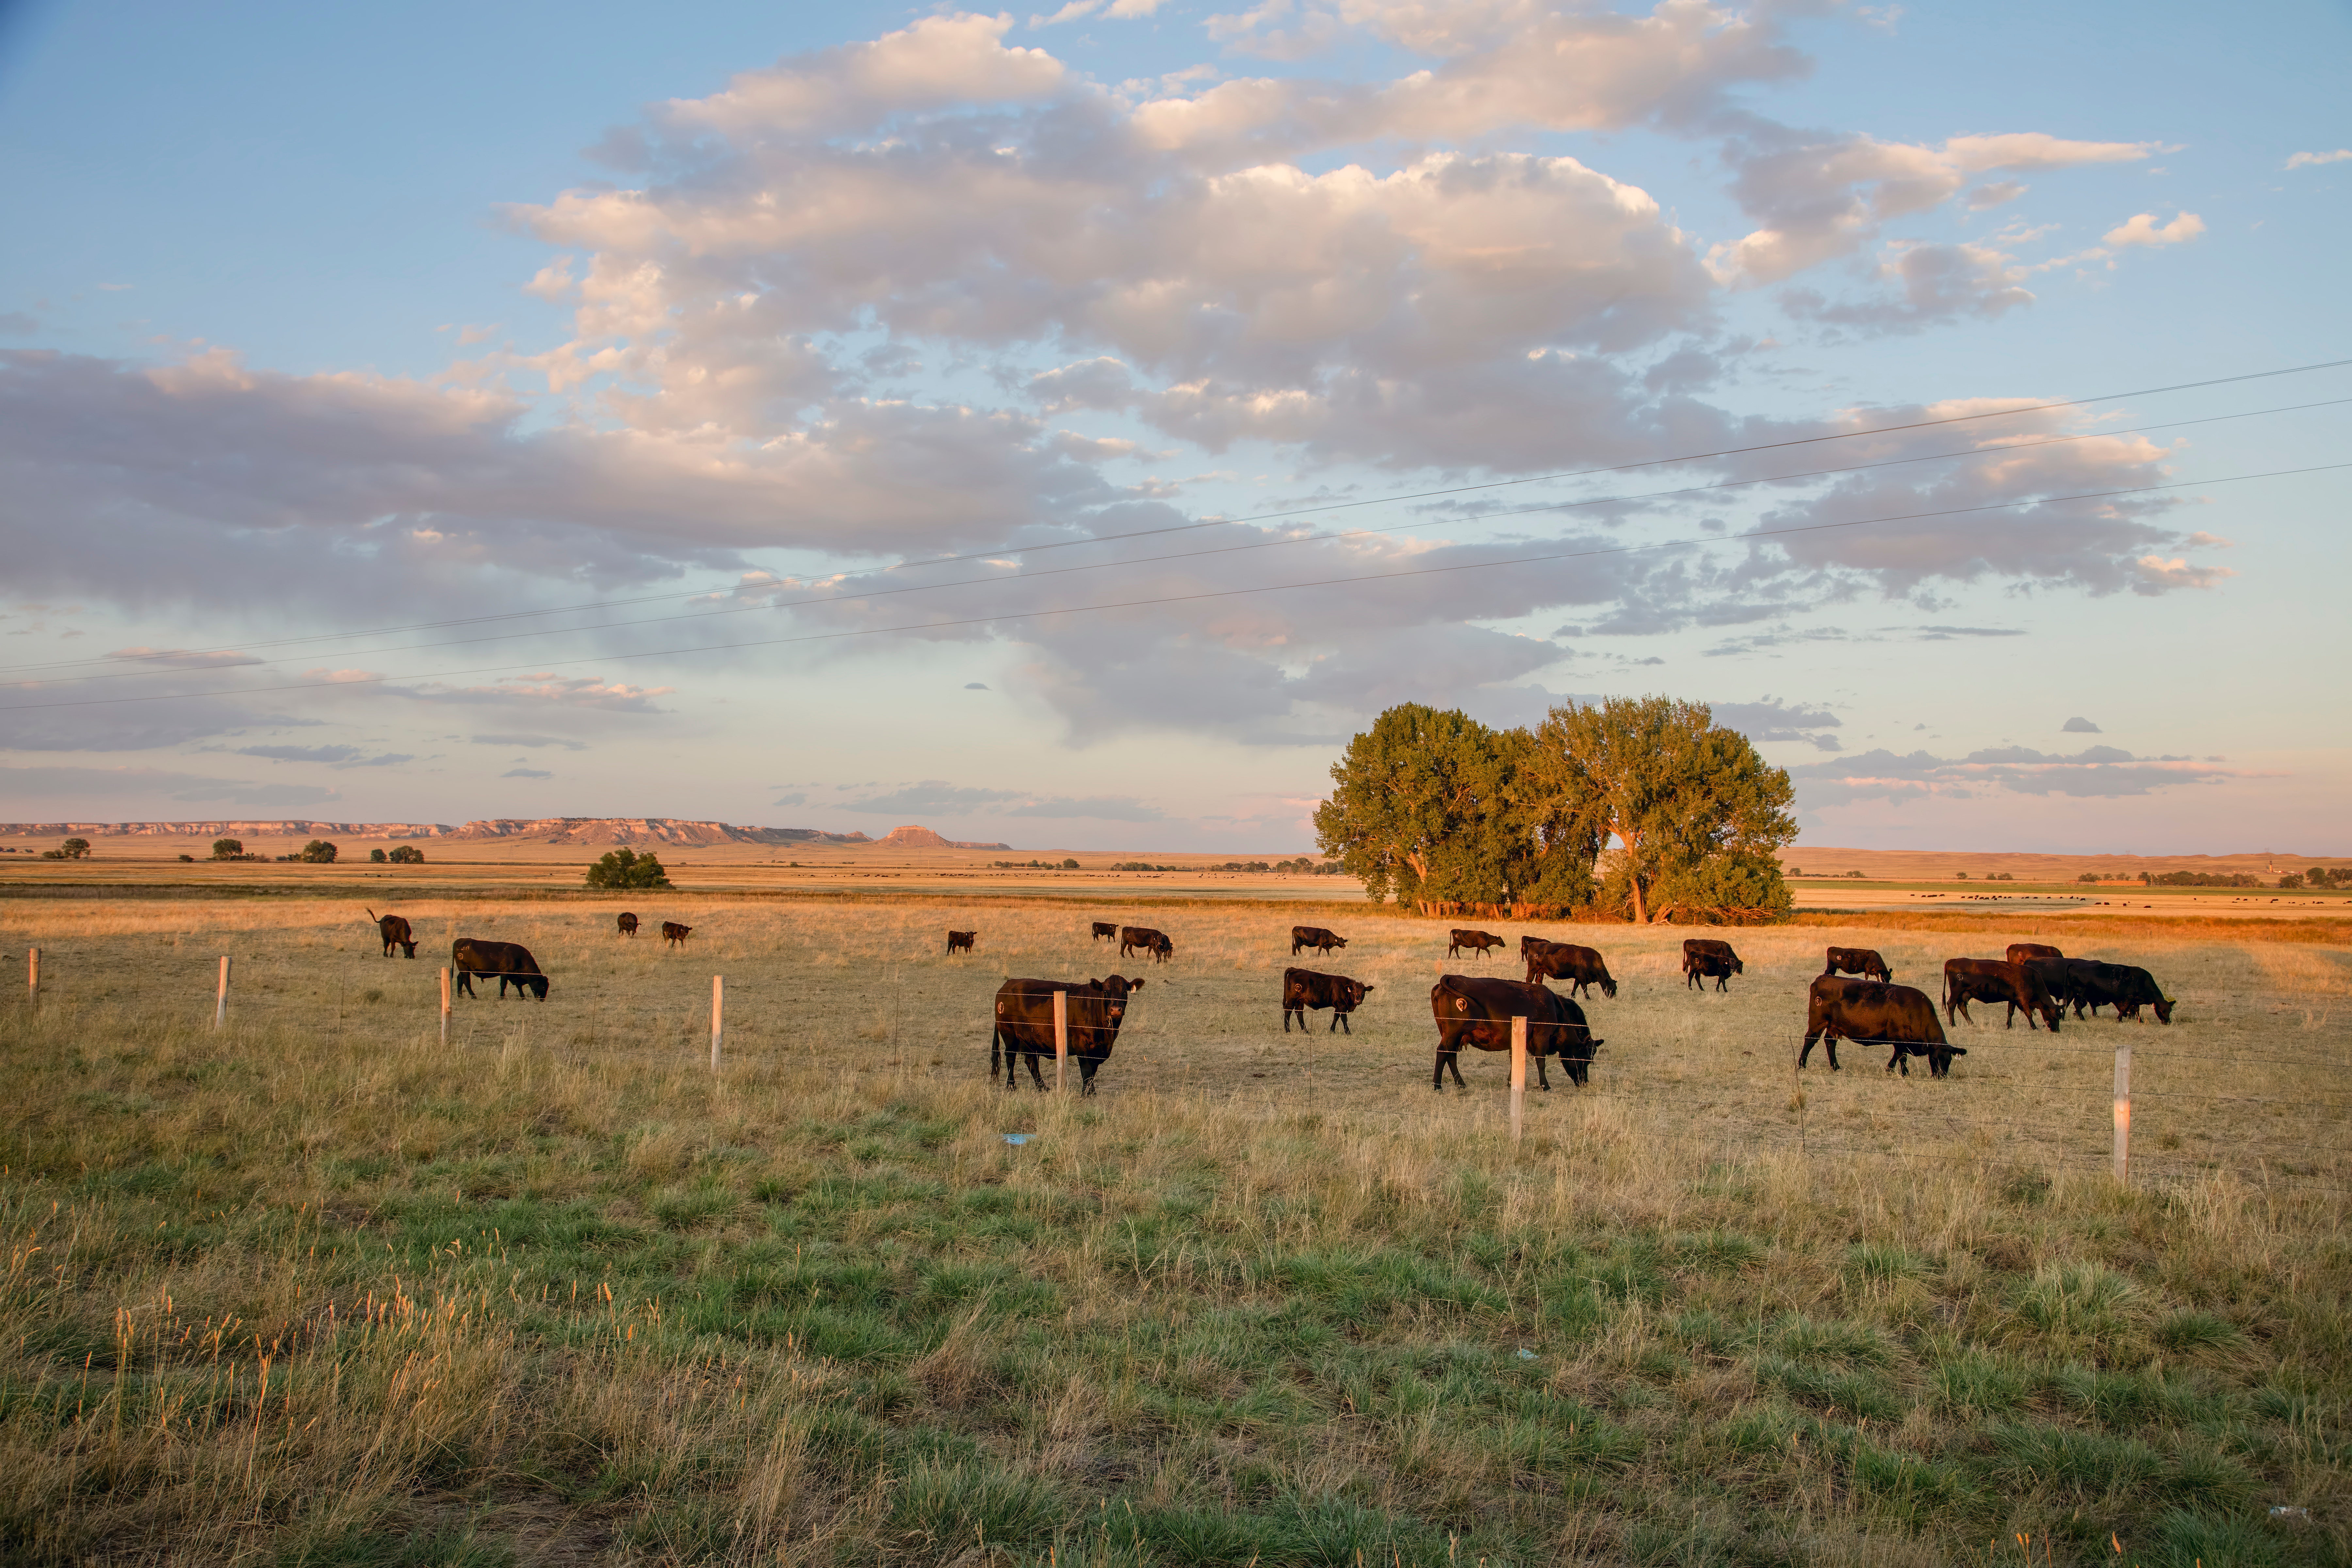
Source: Adobe Stock Livestock herd grazing in an open rangeland pasture Byjia
We recently conducted a webinar on some updates to an important government program
for Montana producers: the USDA’s Pasture, Rangeland, and Forage Insurance (PRF),
which covered 13.6 million acres of perennial pasture and hay in Montana in 2025.
As the signup deadline of December 1st approaches, we encourage producers to make sure they have the information they need
to get the right coverage for their operation.
The full-length webinar is posted at https://youtu.be/tzYteALfUJY
Or view webinar below:
In this post, we offer a summary about what PRF is, what changed this year, and how
producers can make good decisions for their PRF purchases.
What is PRF?
PRF is the USDA’s main insurance product for covering pasture and rangeland. This
insurance triggers based on rainfall. The USDA divides up the US into 200-square-mile
grid squares and estimates average monthly rainfall within each of those squares.
Producers who buy the insurance can divide their coverage over two-month blocks, such
as March-April or July-August. If rainfall in a grid square for a two-month period
falls below a certain threshold—between 70% and 90% of average rainfall, depending
on a producer’s chosen policy—the insurance pays out for any producer with a PRF policy
covering that time period and that grid square.
This program is heavily subsidized. The government pays 59% of the premium for insurance
coverage at a 70% strike rate and 51% of the premium at a 90% strike rate. Because
of this, Montana producers have received more in PRF indemnities (insurance payouts)
than they have spent on premiums in 8 out of the last 10 years. On average, PRF gives
producers more money than it costs. Coverage can be purchased through a crop insurance
agent: RMA’s Agent Locator can help producers find an agent at https://public-rma.fpac.usda.gov/apps/AgentLocator/#!/
What has changed this year?
Starting with 2027 policies, the USDA has updated the weather metrics they’re using
to calculate payments. This change will impact both premiums and the likelihood of
payouts. In some areas, this new metric is more stable, showing fewer years with unusually
low rainfall. In those areas, payouts will be less likely with the new metrics. The
red boxes in the map below indicate places where the new rainfall metrics would have
caused insurance to trigger less frequently, if those metrics had been used over the
last decade.
The blue areas, on the other hand, are places where the new metrics would have triggered
insurance payouts more frequently using the new measures. Blue areas may face higher
premiums but receive more frequent payouts going forward.
However, blue or red areas won’t necessarily become better or worse deals for PRF
because premiums will adjust too. In red areas, premiums should fall to reflect the
lower payout probability. In blue areas that are now riskier for insurers, premiums
will likely rise.
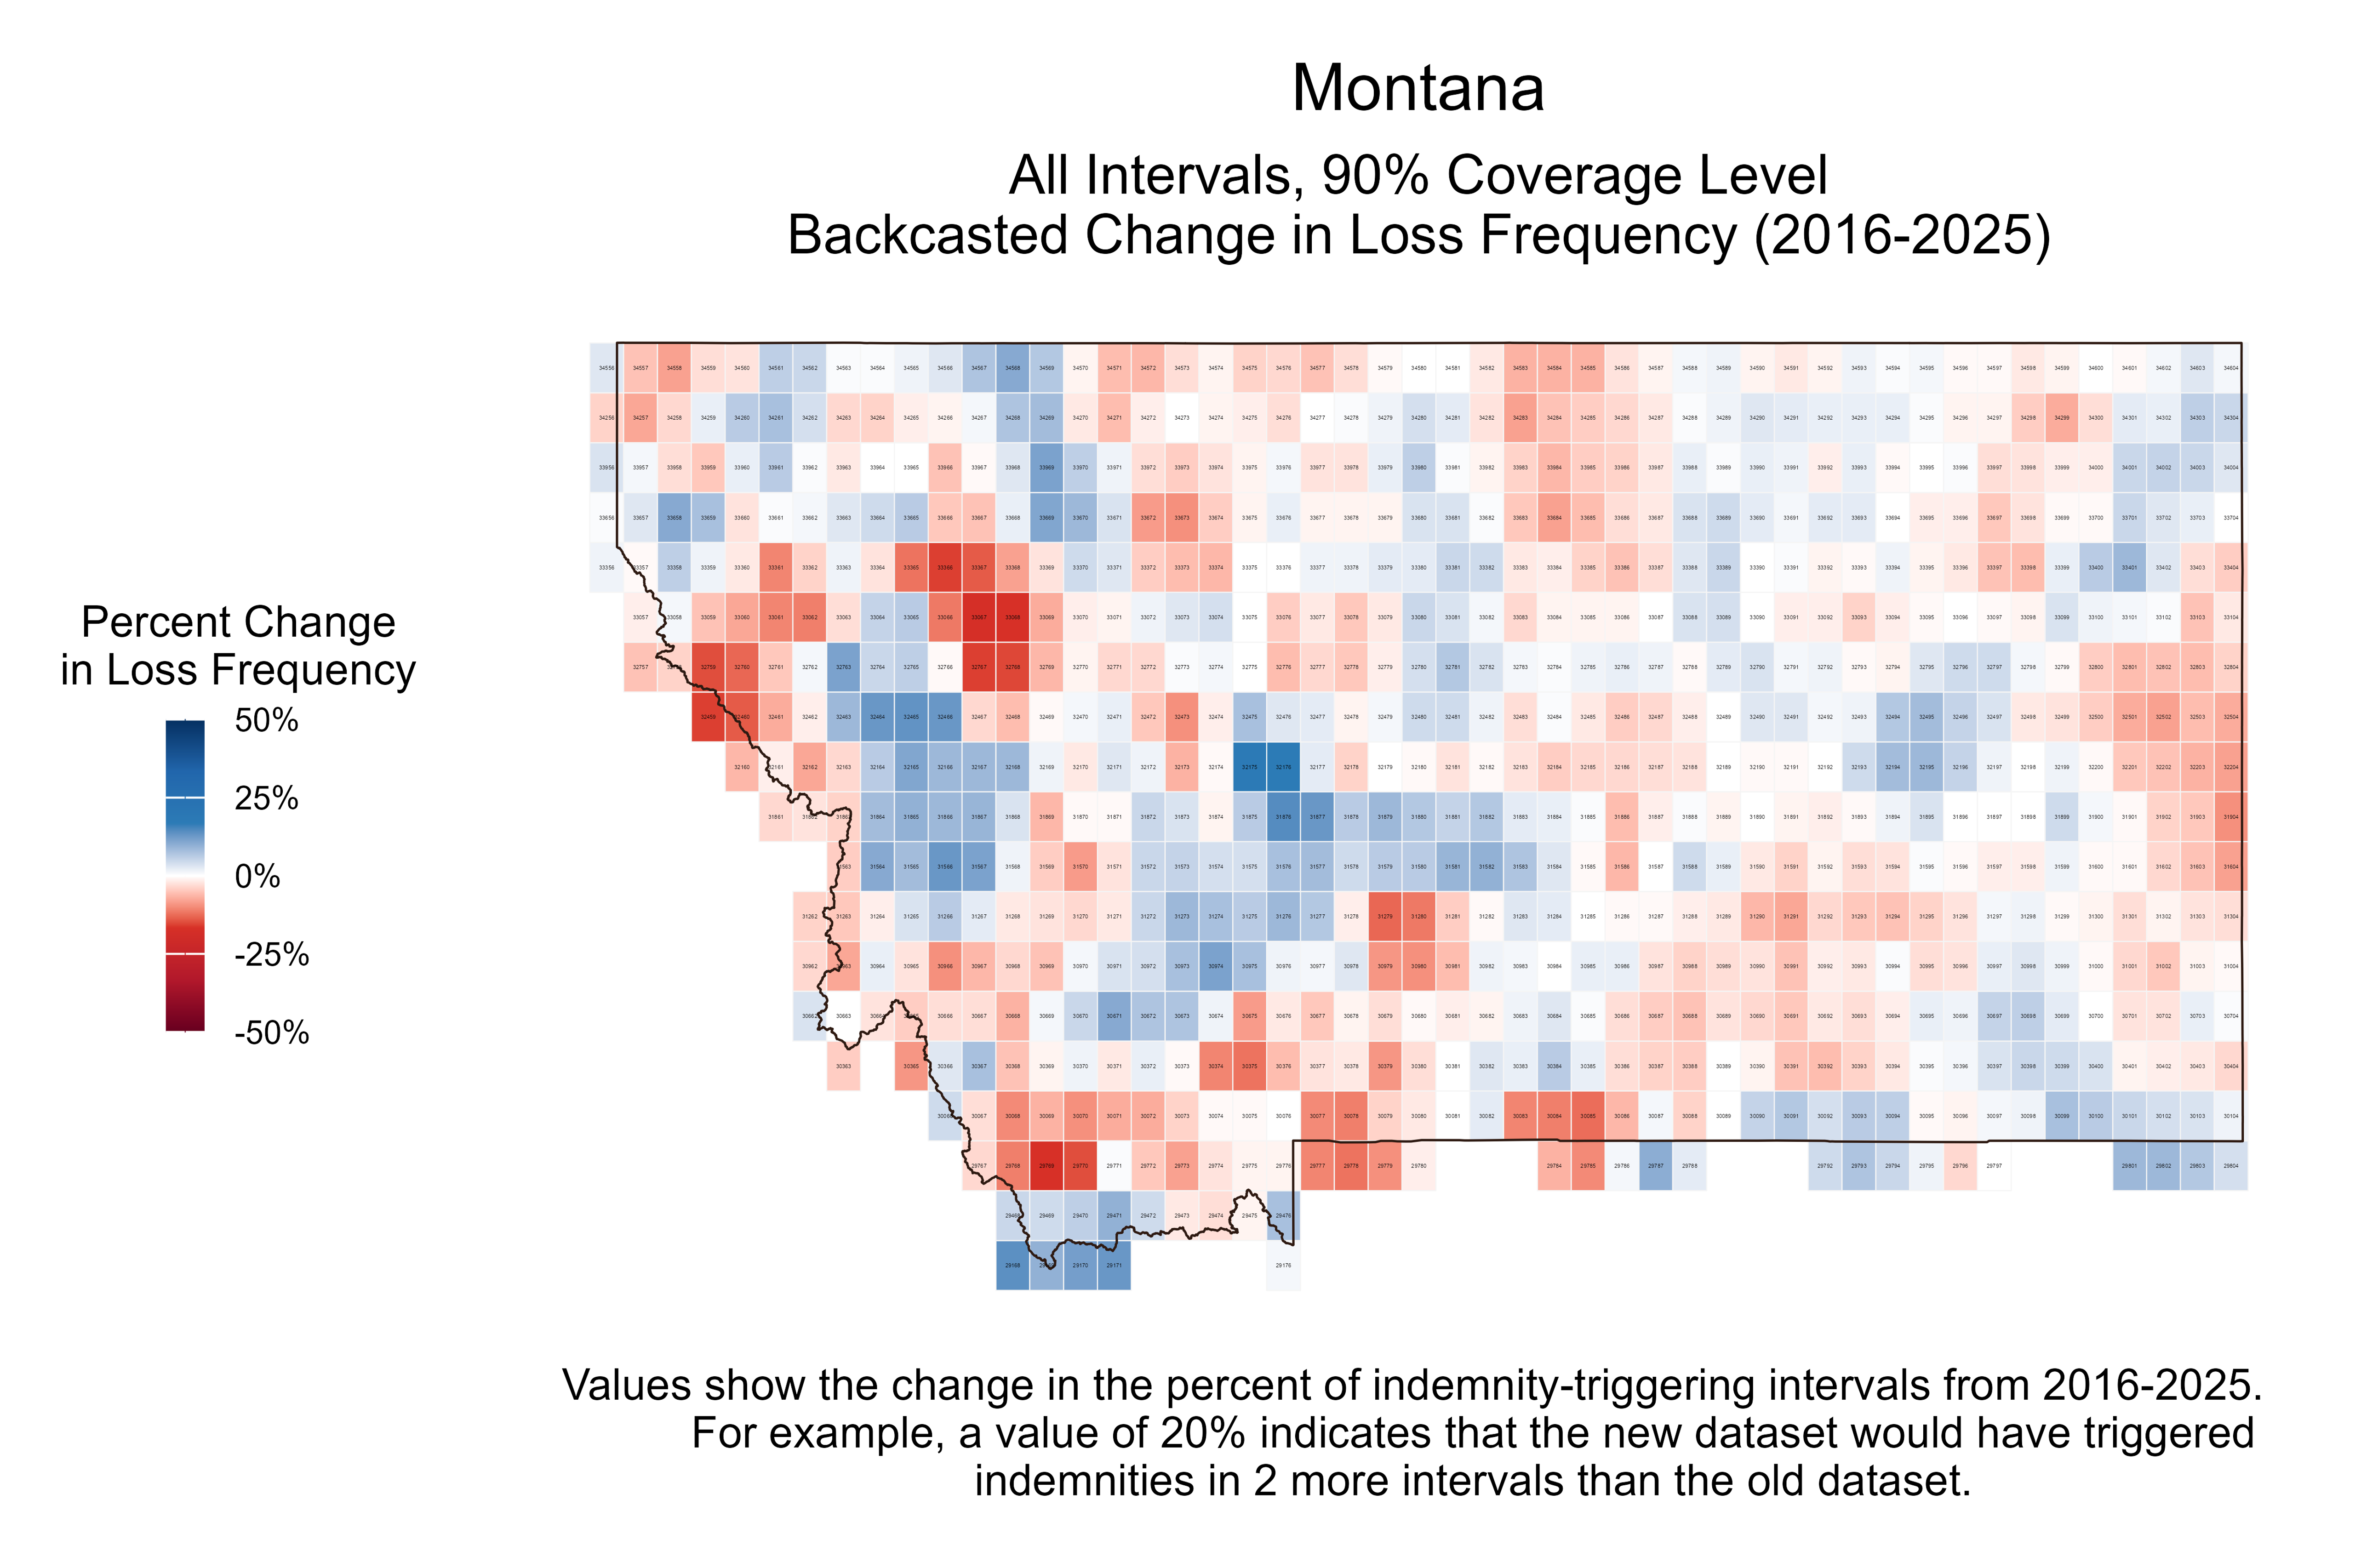 Source: Watts and Associates, Inc
In addition to this change in measurements, the USDA also changed two other important rules for 2027:
- Producers now cannot put more than 25% of their coverage weight on the January-February interval.
- Producers must maintain livestock on the insured land with at least 25% of the recommended stocking rate. Producers must keep records that can verify the number of animals on the land (such as veterinary records, financial records, or pregnancy check records) for three years, and must show the USDA these records on request.
A concern for 2027: El Nino
El Nino is a cyclical weather pattern caused by warm waters in the Pacific Ocean.
El Nino is currently surging, and it’s expected to have effects through at least spring
2027. For Montana, El Nino typically causes drier weather patterns, and NOAA predicts
that the winter and summer are more likely to experience below-average precipitation.
This means that PRF payments are more likely for Montana producers in 2027.
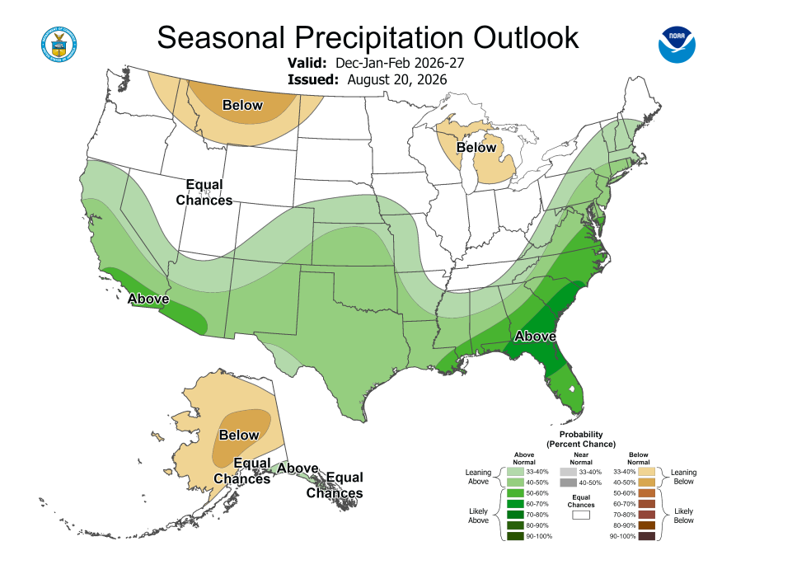
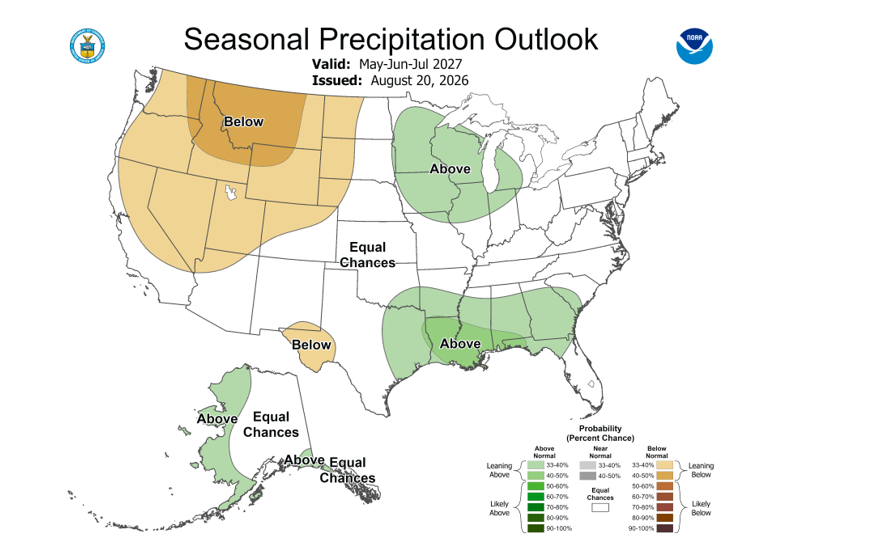
Source: National Weather Service Climate Prediction Center, https://www.cpc.ncep.noaa.gov/products/predictions/long_range/
How can producers decide on the right PRF coverage?
In picking the right PRF coverage, producers want to ask two key questions: what coverage
will best protect a producer against the risk of drought? And what coverage will offer
the best financial returns?
To help with both these questions, the USDA has a useful PRF Support Tool, available
at https://public-rma.fpac.usda.gov/apps/PRF. To use it, you can follow these steps:
1. Locate your grid number. On the grid locator tab, click on the magnifying glass icon, search for an address
near you, and then click on the map near your operation. For example, this producer
searched for Red Lodge as a map reference, then clicked on the map near the ranch’s
actual location. Their operation is in Grid ID 30678. If they buy PRF, their payments
will be based on rainfall in 30678.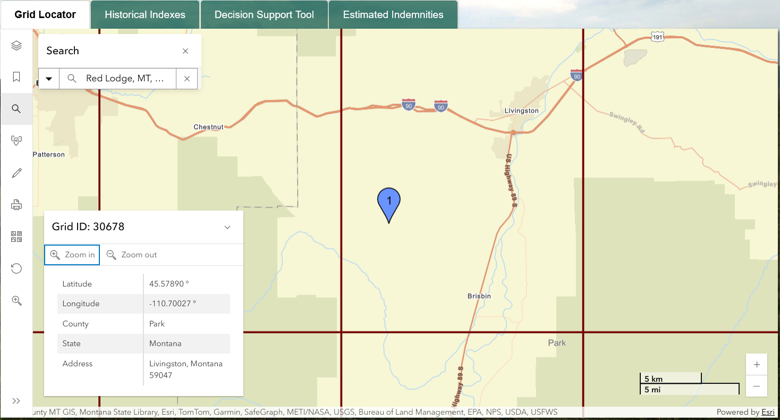
Source: USDA Pasture, Rangeland, Forage Support Tool, screenshot by authors.
2. Compare the grid’s history to your history. Open the “Historical Indexes” tab and put in your grid number. This shows the rainfall index used to trigger payments. When this number falls below the producer’s chosen threshold of 90 or 70%, payouts start, and payments grow when the index is lower. All highlighted blocks would have received a payout with a 90% insurance policy. Before staring at these numbers, consider: which years in the last decade were the worst for forage growth on your operation? Then look and see which years would have actually received PRF payments. If our example producer’s worst years had been 2017 and 2020, then PRF might have offered some good payouts at the right time, particularly if the producer’s policy mostly covered April through September. On the other hand, if 2019 and 2024 were the producer’s worst years, PRF would barely have paid out when most needed. In that case, it’s likely that PRF’s measure is a bad match for this producer’s real rainfall and won’t reduce their risk much.
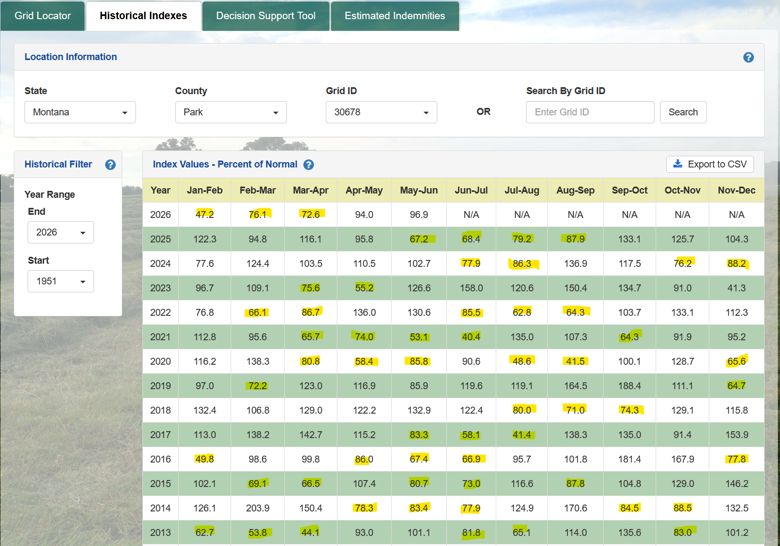
Source: USDA Pasture, Rangeland, Forage
Support Tool, screenshot by authors.
3. Explore premiums and indemnities. Switch to the “Decision Support Tool” tab, and enter some details of a potential
policy: the coverage level, the insured acres, and the spread of coverage across two-month
periods. The coverage levels below reflect an even-weighting strategy that spreads
coverage equally across the year. The Producer Premium gives the premium a producer
would pay under the current rules. The “Total” row at the bottom shows the total year’s
premium. The Estimated Indemnity shows how much an insurance policy under current
rules would have paid out in the sample year. When the estimated indemnity for a year
is larger than the producer premium, the producer received more than they paid in
premiums. So in 2025, if our producer had purchased this policy, they would have paid
$462 in premiums, received $503 in indemnities, and ended the year with $41 in net
payments. The “Estimated Indemnity” tab can then show how the Estimated Indemnity
number would have changed over time given this policy choice. You can revise the “Decision
Support Tool” policy choices to see how different numbers would have paid out.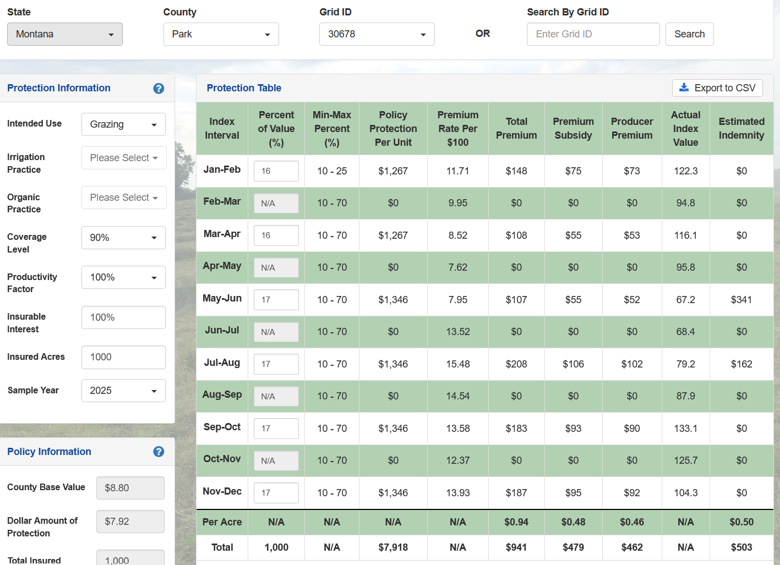
Source: USDA Pasture, Rangeland, Forage Support Tool, screenshot by authors.
The U.S.D.A., Montana State University and Montana State University Extension prohibit discrimination in all of their programs and activities on the basis of race, color, national origin, gender, religion, age, disability, political beliefs, sexual orientation and, marital and family status. Issued in furtherance of cooperative extension work in agriculture and home economics, acts of May 8 and June 30, 1914, in cooperation with the USDA, Cody Stone, Director of Extension, Montana State University, Bozeman, MT 59717.